Today, the US economy announced another brutal unemployment claims number, bringing the total to 20.5 million and resulting in a 14.7% unemployment rate – the highest since the Great Depression. Many questions remain, from where will this slide end to how will this impact staffing.
For those new to this brief blog, the numbers reflected are based on an aggregation of hosted Avionté data from hundreds of customers across the US. We used a “same store sales” approach to ensure the data is clean. All hours, assignments and gross payroll are from transactions that were processed. These numbers reflect a Sunday end date of May 3rd, 2020. We call this blog Avionté RAW, because we are emphasizing the “raw” data as opposed to inferring the meaning behind the data. Every staffing company is different and will draw conclusions based on their business model. We don’t exactly know what is going to happen next but our hope is that this will offer insight as to where things have been and potentially where they may be headed.
The upshot for Week 18 was a continued stabilization of our staffing numbers. In fact, all major performance indices tracked (hours, assignments and gross) were in positive territory on a WoW (Week over Week) basis. Here are the numbers:
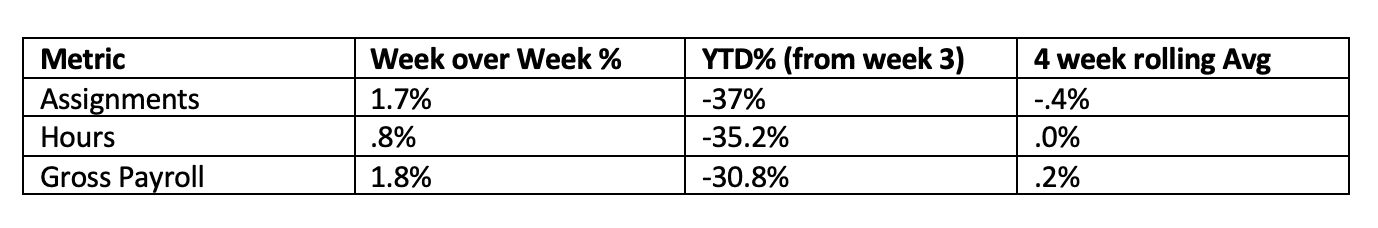
While the WoW numbers softened some from Week 17 to Week 18, this was the third week in a row for flat or positive numbers. In fact, the four week rolling average for gross payroll moved into positive territory. To us, this is a clear sign of stabilization. We are worried about periodic plant/factory shutdowns, but it seems that these could be significantly outweighed by the American appetite to reopen the economy.
There is still significant worry about finding workers when unemployment benefits pay more than going to work. The mean pay rate, a composite statistic that we track, has crept up from $16.22 in week 4 to $17.32 in week 18. The average number of hours per assignment has remained fairly steady, with a week 18 mean of 32.91.
Users
We are also tracking our distinct users as a proxy for what staffing companies are thinking from an internal staff point of view. Week 18 showed a slight (-.3%) decline in WoW%, though the last three weeks have all been < +/- 1%. Overall, for the year, the mean user count has declined by 22.8%. We would expect staffing companies to be cautious about rehiring internal staff.
Graphs
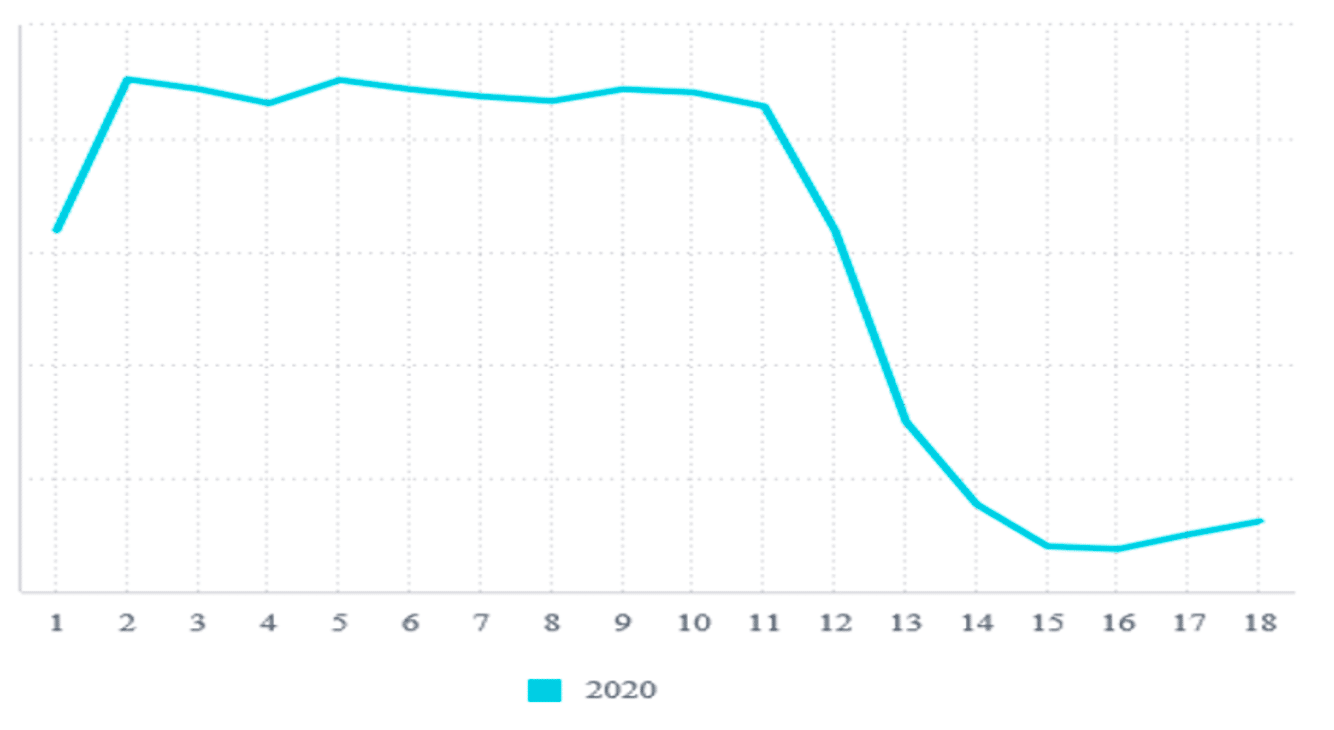
For this week, we have started to apply a Business Intelligence tool – Sisense – to our aggregated data.
Assignments Worked 2020
Gross Wages
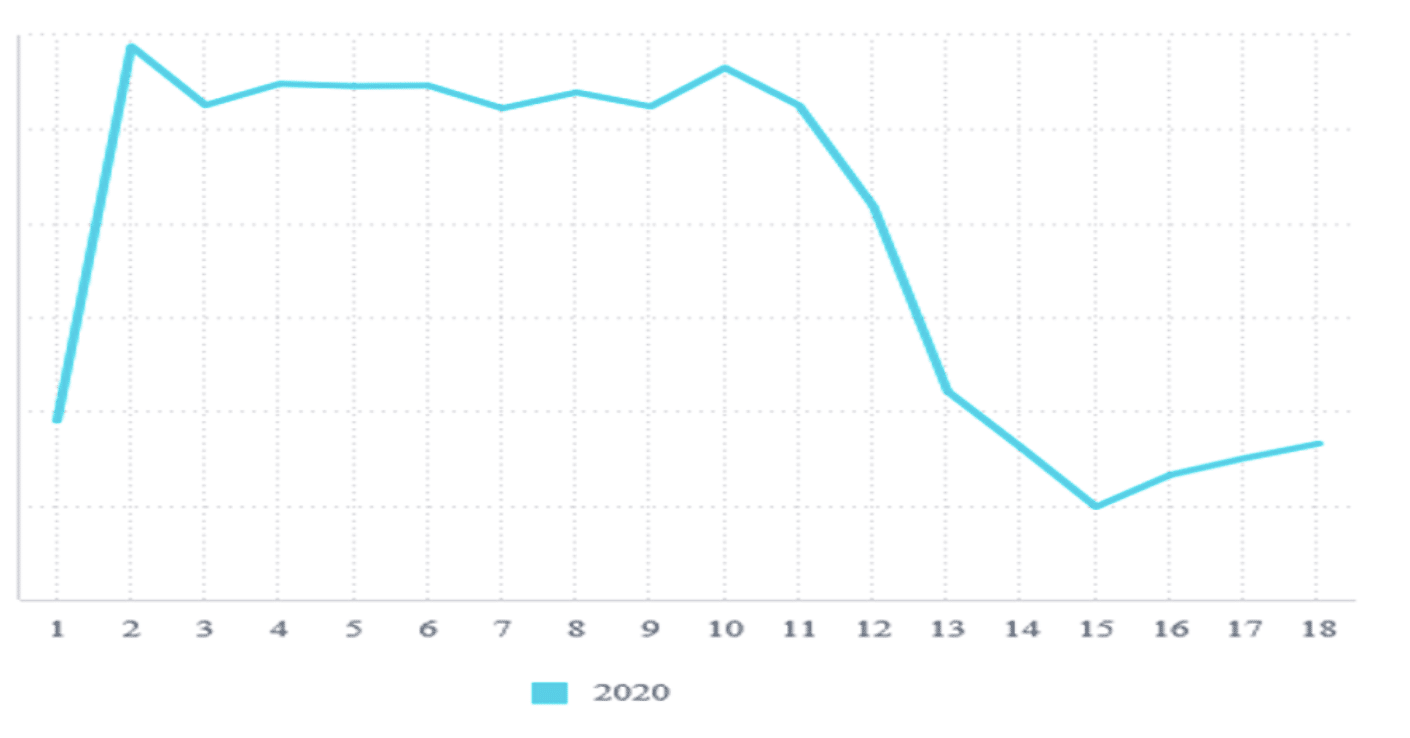
Hours Paid 2020
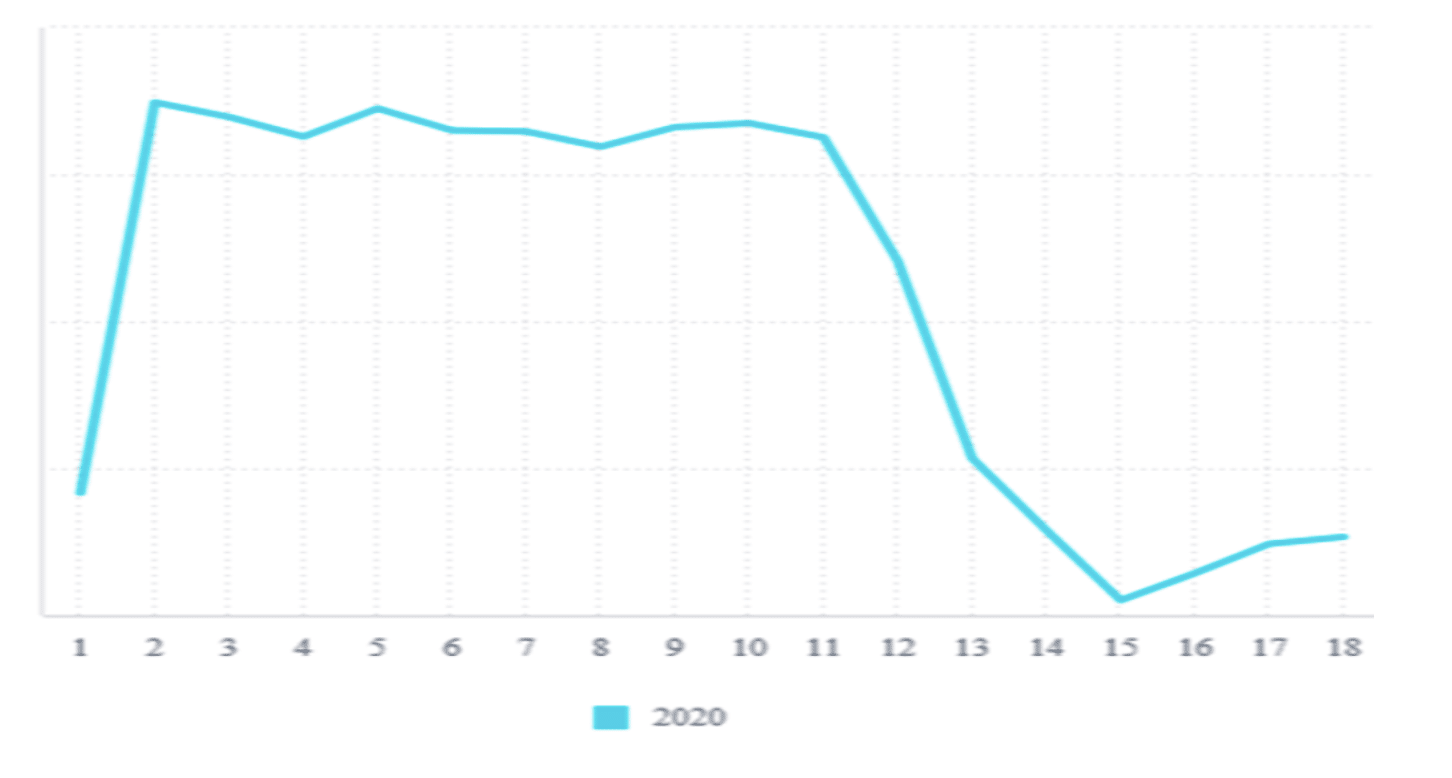
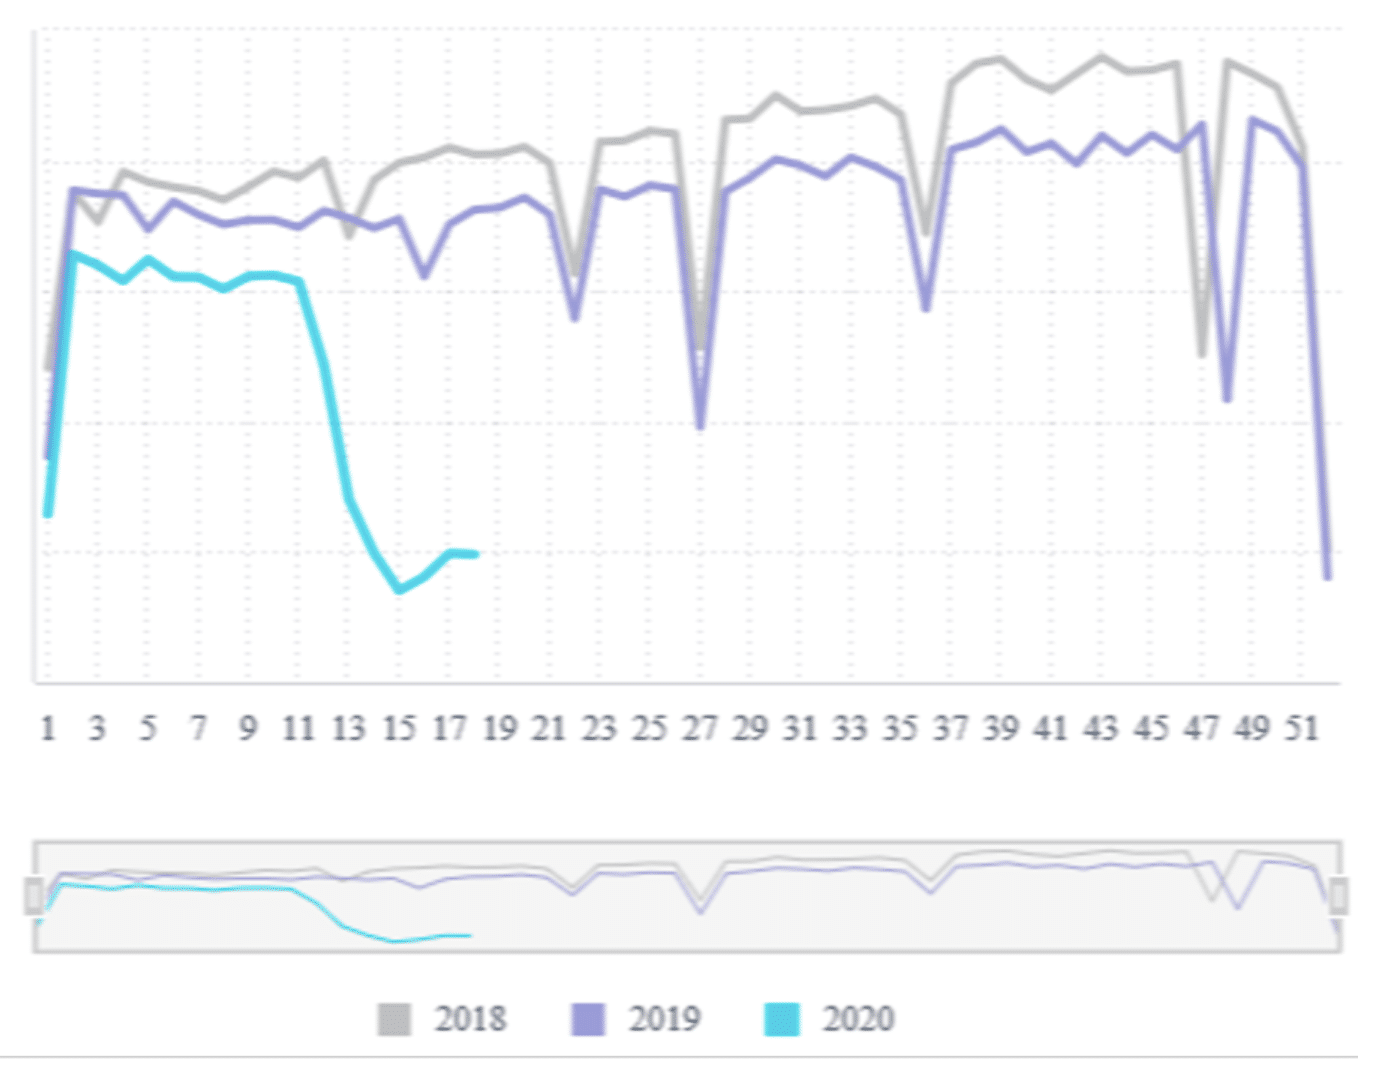
For a Year over Year comparison – here is a graph of hours for customers since 2018:
Total Hours Paid 2018+
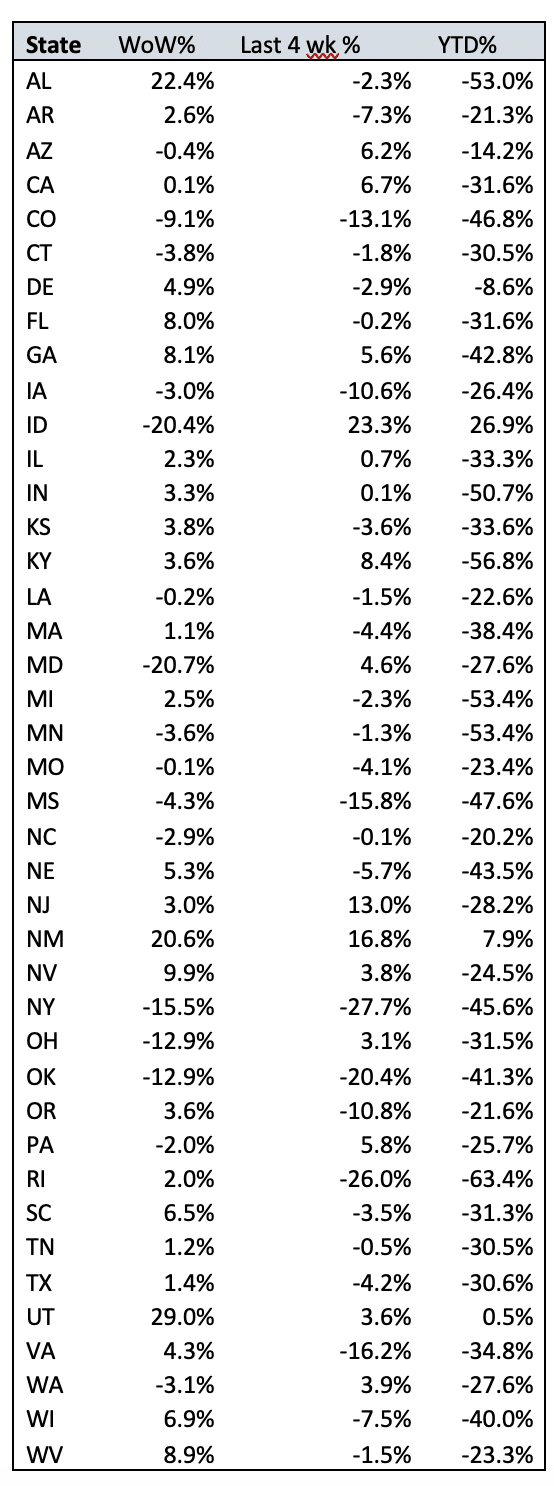
States
New for this week is a listing of hours for each state, broken down by WoW, last four weeks and YTD change. The state is where the work was performed (customer worksite) and we’ve only included states where we have substantial hours, to help display trending. Note, these numbers still have the potential to be skewed by large bi-weekly payrolls or similar big swings. Hours is the only statistic we are reporting at the state level, because hours is not subject to state or regional differences in pay rates.
Overall, we are gaining confidence that we are at the bottom of the cycle. As always, please feel free to send me any questions or suggestions, as we continue to improve this service.
John Long, Founder, Co-Chairman
jlong@avionte.com