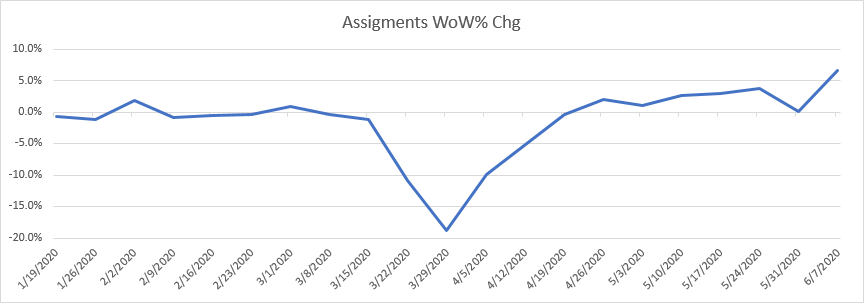
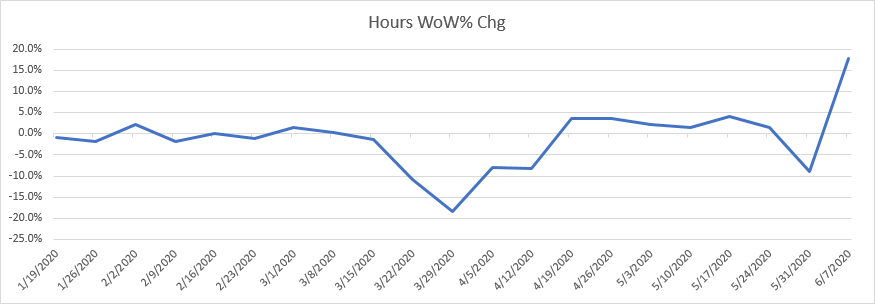
Did we read that right? Hours up 17.9% week over week!
Yup – huge week for staffing! Now, about half of that is a bounce back from the short Memorial week, but even if we compare week 21 to week 23, we see a 7.5% increase in hours.
For those new to the Avionté RAW series, the numbers reflected are based on an aggregation of hosted Avionté data from hundreds of customers across the US and Canada. We used a “same-store sales” approach to ensure the data is clean. All hours, assignments, and gross payroll are from transactions that were processed. These numbers reflect a Sunday end date of May 31st , 2020. We call this blog Avionté RAW, because we are emphasizing the “raw” data as opposed to inferring the meaning behind the data. Every staffing company is different and will draw conclusions based on their business model. We don’t exactly know what is going to happen next, but our hope is that this will offer insight as to where things have been and potentially where they may be headed.
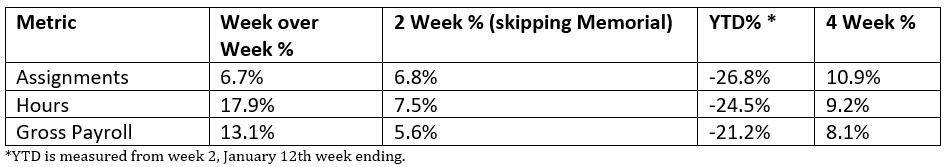
Week 23 was a very strong week. We included a 2-week comparison, which bypasses the Memorial Day week.
Here are the numbers:
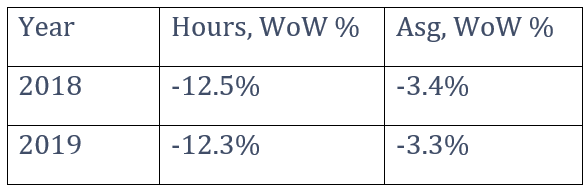
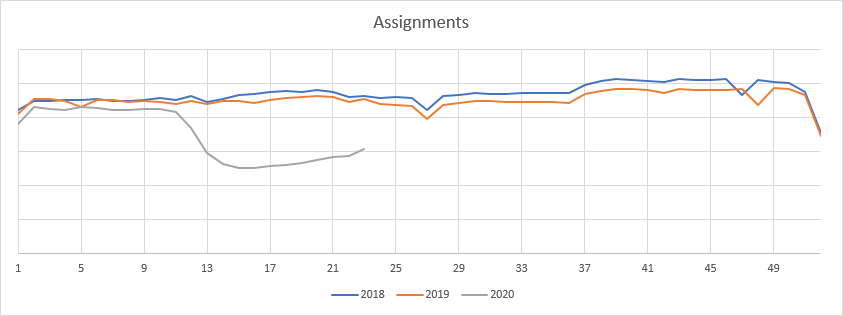
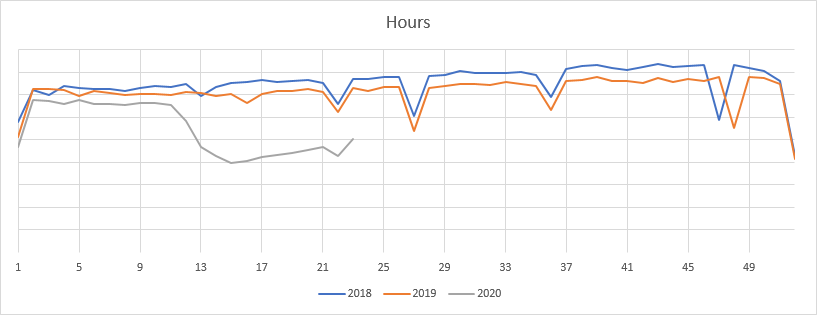
To provide context on the effect of a shorter week, let’s look at 2018 and 2019 on Memorial Day week for both Hours and Assignments.
The only potential worrisome statistic is the sharp decline in mean pay rate. Even comparing to two weeks prior, (which mitigates the effect of bi-weekly payrolls and the memorial week) we still see a decline from $17.17/hr average in week 21 to $16.87 in week 23. On the positive side, this could support the notion that more lower-paid talent accepted assignments, which is a great indication of economic growth.
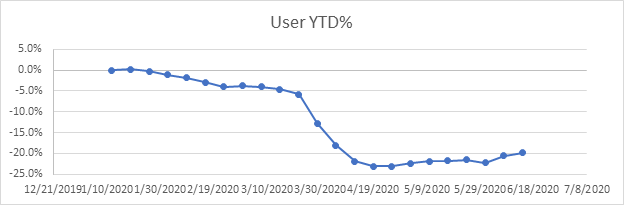
Users
We are also tracking our distinct users as a proxy to see what staffing companies are thinking from an internal staff point of view. Week 23 continued a positive trend with a significant .9% increase. We have seen five straight weeks of growth, not including the short Memorial Day week, bringing the total YTD decline to 19.9%.
Staffing Data Results Graphs
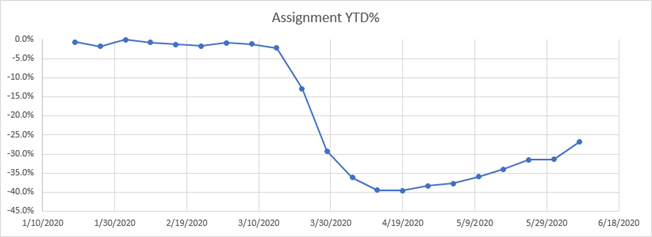
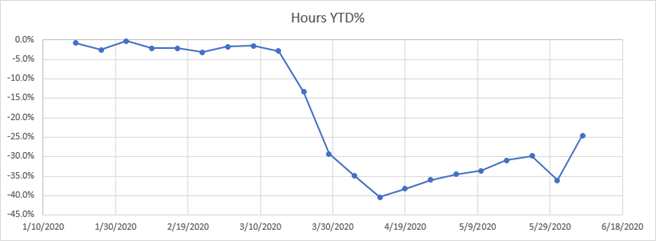
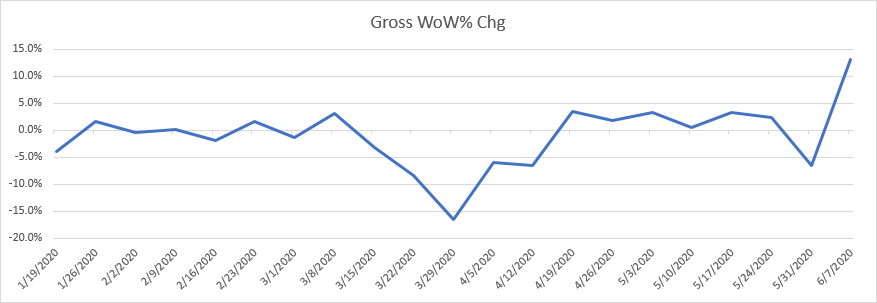
Rate of Change
Rate of change shows the percentage movement week-over-week in order to get a sense of trending up (or down) in addition to velocity.
For a Year over Year comparison: Here is a graph of hours for customers since 2018:
Individual State Performance
The state is where the work was performed (customer worksite) and we’ve only included states where we have substantial hours (> 10,000), to help display trending. Note, these numbers still have the potential to be skewed by large bi-weekly payrolls or similar big swings.
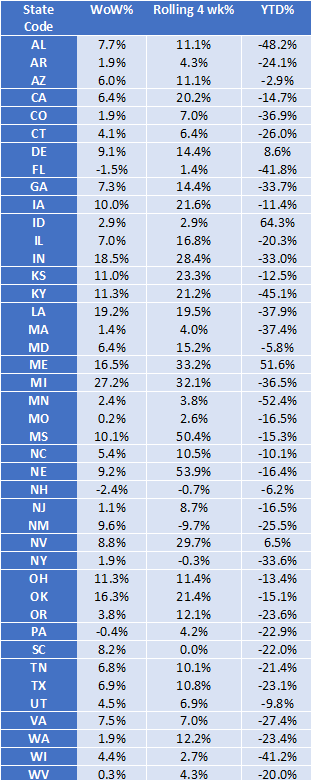
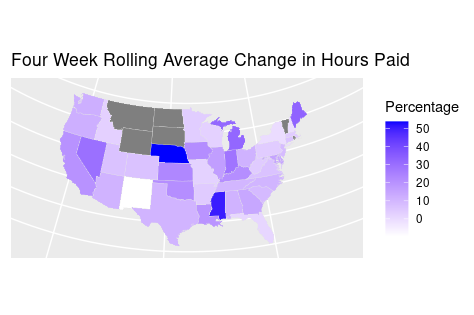
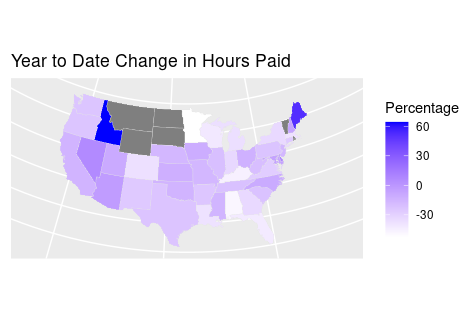
*Grey states are not reported due to insufficient data
Written by, John Long, Avionté, Founder & Co-Chairman, and Natalie Flint
In addition, we have added COVID-19 Resources to our website. This resource center provides information from across the US and Canada that could affect how you do business. Check it frequently for the latest information and business trends occurring during these challenging times.
About Avionté
Avionté is a leader in enterprise staffing and recruiting software solutions, offering innovative end-to-end staffing solutions to over 900 customers and 25,000 users throughout the U.S. and Canada. Avionté delivers a robust platform for clerical, light industrial, IT, and professional staffing firms to maximize profits and boost productivity.