We’d like to save everyone that moment of panic that we had yesterday when seeing the staffing data for the first time this week. Hours were down 9.1%! What?! Oh yeah, Memorial Day!! All is good, and in fact, we think we can show that the week was actually quite good comparatively.
For those new to the Avionté RAW series, the numbers reflected are based on an aggregation of hosted Avionté data from hundreds of customers across the US and Canada. We used a “same-store sales” approach to ensure the data is clean. All hours, assignments, and gross payroll are from transactions that were processed. These numbers reflect a Sunday end date of May 31st, 2020. We call this blog Avionté RAW, because we are emphasizing the “raw” data as opposed to inferring the meaning behind the data. Every staffing company is different and will draw conclusions based on their business model. We don’t exactly know what is going to happen next, but our hope is that this will offer insight as to where things have been and potentially where they may be headed.
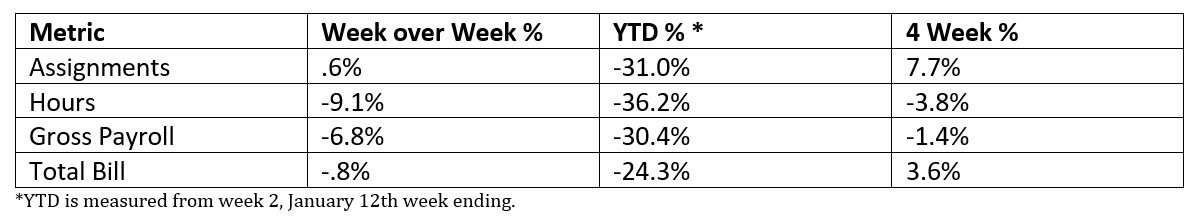
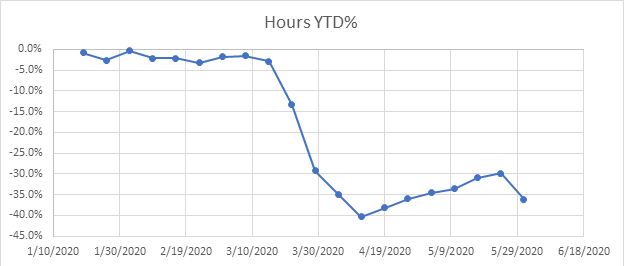
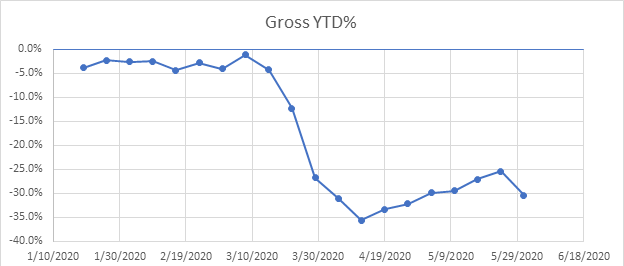
The week showed a steady assignment number, but did have a substantially negative week in hours/gross/total bill due to the Holiday. Here are the numbers:
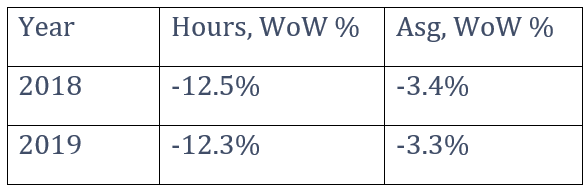
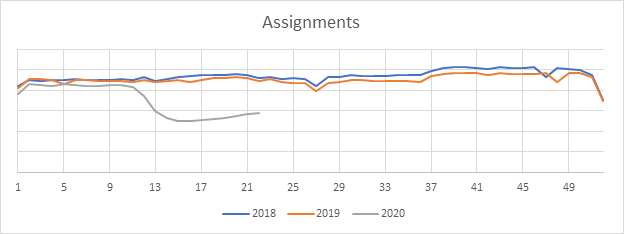
To provide context on the effect of a shorter week, let’s look at 2018 and 2019 on Memorial Day week for both Hours and Assignments.
First off – we thought those were remarkably consistent. We were also surprised that hours weren’t off 20% (1 of 5 business days) or even 14% (1 in 7 days). Three factors could come to mind – all depending on the type of contingent work:
Holiday Pay: that the talent was paid on Memorial Day regardless
Worked: that work was performed during the Holiday
Made up hours: that hours were made up for the rest of the week
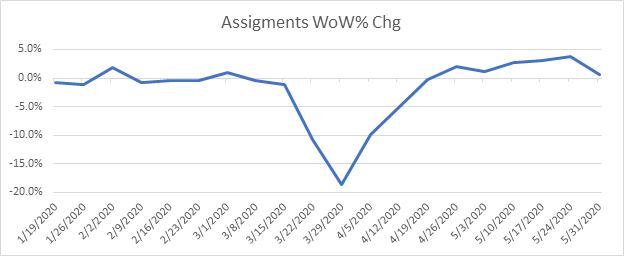
The big news, though, was that for 2020, hours were “only” off 9.1% vs the historical 12.4% average. To us, this supports the notion that the organic growth for the week was roughly 3.3%, which is above the last six weeks of average growth rate (2.8%). Further, Assignments grew (new starts!) which was not the trend in previous years.
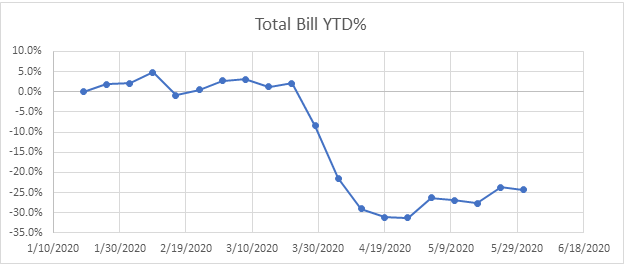
Total Bill New this week – Total Bill. For at least this week, the numbers reflect the total invoice amount for the PROCESS date of the invoice. Previously, we looked at Total Bill based on our Accounting Period, but a statistically relevant percentage of invoices (5%) were invoiced more than seven days past the week ending date. By going with the Process date, we still get a good metric on total bill. A small side note – because of the Process Date methodology, I moved the YTD% calculation to be off week 3, not week 2 like for hours, assignments, and gross.
Another note – at this point, the total bill reflects both perm placement fees as well as traditional staffing. In subsequent weeks, we’ll pull those numbers apart.
Users We are also tracking our distinct users as a proxy to see what staffing companies are thinking from an internal staff point of view. Week 22 showed a large increase of 2.2%. That weekly increase was the largest all year! Hopefully, this is an indication that staffing firms see that the recovery does seem to have legs and are bringing back staff.
Graphs
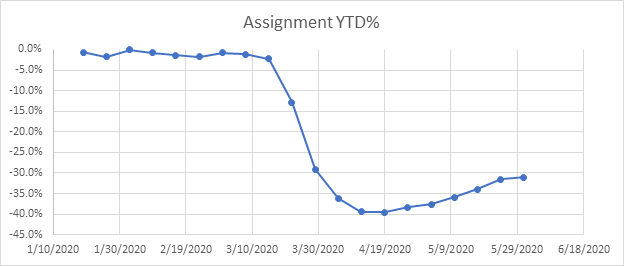
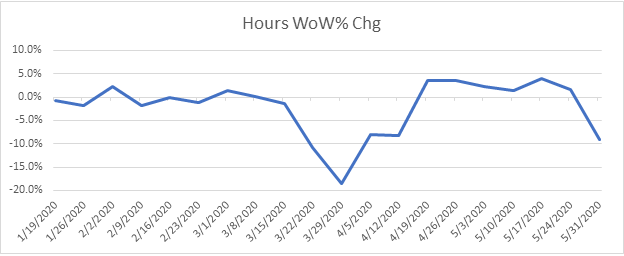
Rate of Change For this week, we thought it would be good to start looking at the rate of change for each week. Clearly, we are trending up – but are we gaining momentum or staying pretty consistent?
For a Year over Year comparison: Here is a graph of hours for customers since 2018:
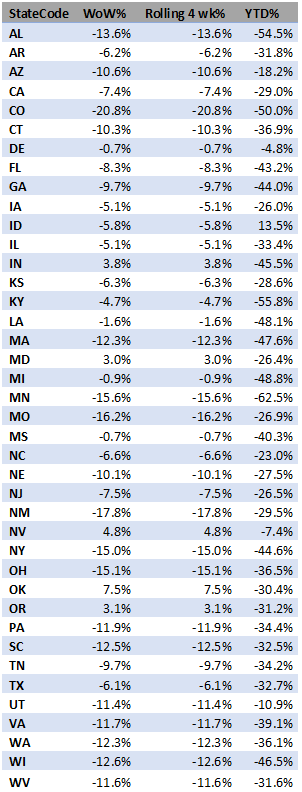
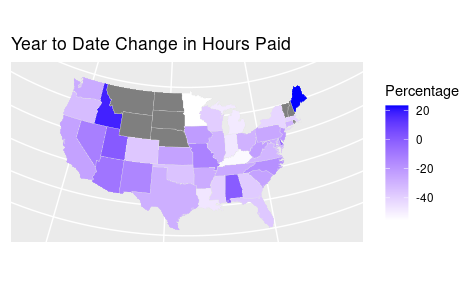
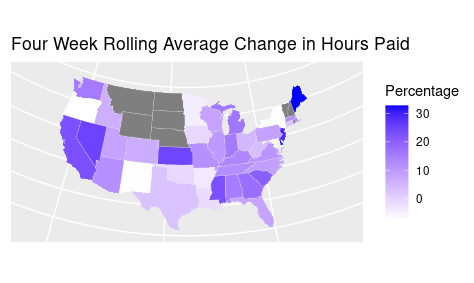
States We also like to show the individual state performance. The state is where the work was performed (customer worksite) and we’ve only included states where we have substantial hours (> 10,000), to help display trending. Note, these numbers still have the potential to be skewed by large bi-weekly payrolls or similar big swings.
*Grey areas not reported due to insufficient data
Canadian Provinces
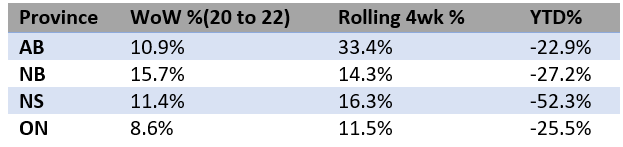
For the first time, we have included Canadian provinces. Some provinces were not included because they either had only a couple hundred hours or they fluctuated too much from week to week. For week over week percentage change, we used the 20th and 22nd weeks because the week of the 21st included the Canadian holiday Victoria Day and caused it to look like there was a large jump in percentage change for this week. For this year so far, there have been large increases in the number of hours paid for each province, but especially in Nova Scotia. Having all positive numbers for WoW% and Rolling 4wk % changes shows that Canada’s economy is rebounding very well post Coronavirus lockdowns and shutdowns.
Written by, John Long, Avionté, Founder and Co-Chairman
In addition, we have added COVID-19 Resources to our website. This resource center provides information from across the US and Canada that could affect how you do business. Check it frequently for the latest information and business trends occurring during these challenging times.
About Avionté Avionté is a leader in enterprise staffing and recruiting software solutions, offering innovative end-to-end staffing solutions to over 900 customers and 25,000 users throughout the U.S. and Canada. Avionté delivers a robust platform for clerical, light industrial, IT, and professional staffing firms to maximize profits and boost productivity.
WorkN is now Avionté Mobile. Building on the power and functionality of WorkN’s talent mobile app, Avionté Mobile is built for the high-volume staffing and recruiting industry.